Databox

Databox

Rated 0.0 out of 5
Databox data Reporting and analytics tool

Databox- Analytics, Reporting & Visualization platform

Databox is a cloud-based business analytics and KPI dashboard platform that provides real-time insights into key performance indicators across various sources.

Databox offers a user-friendly interface and a wide range of integrations with popular data sources, making it easy for businesses to monitor and analyze their data in one central location

Key Features

  • Reports – Create and customize reports to get insights into your data.
  • Dashboard Designer – Create visually stunning dashboards to track your key metrics.
  • Dashboard Reporting – Share your dashboards with others and collaborate in real-time.
  • Databoards – Combine data from multiple sources into a single dashboard.
  • Custom Metric Builder – Create custom metrics based on your unique business needs.
  • Data Calculations – Perform calculations on your data to gain deeper insights.
  • Metric Tracking – Track your metrics over time and see how they change.
  • Business Goal Tracking – Set and track business goals to stay on track.
  • Scorecards – Create scorecards to evaluate performance against targets.
  • KPI Tracking – Track your key performance indicators to ensure success.
  • TV Dashboards – Display your dashboards on a TV for easy team viewing.

Pros and Cons

FAQs

  • 1. What is Databox?

    Databox is a business analytics platform that helps businesses track and visualize key performance indicators (KPIs) from various data sources in real-time dashboards.

  • 2. What are the alternatives to Databox?

    Some alternatives to Databox include Tableau, Power BI, Klipfolio, Grow, Geckoboard, and Cyfe, each offering their own features for data visualization and tracking.

  • 3. What is Azure Databox?

    Azure Databox is a data migration and transfer service by Microsoft Azure, designed to securely move large amounts of data to the Azure cloud

  • 4. Can I use Databox for mobile reporting?

    Yes, Databox offers mobile reporting capabilities, allowing users to access and monitor their KPIs and dashboards from mobile devices.

  • 5. What types of data visualizations does Databox offer?

    Databox offers various data visualizations such as line charts, bar charts, tables, pie charts, and custom widgets to present KPIs and insights

  • 6. What industries benefit from using Databox?

    Databox is beneficial for a wide range of industries, including e-commerce, marketing, sales, finance, and business management, by providing insights and analytics for informed decision-making.

databox pricing plans

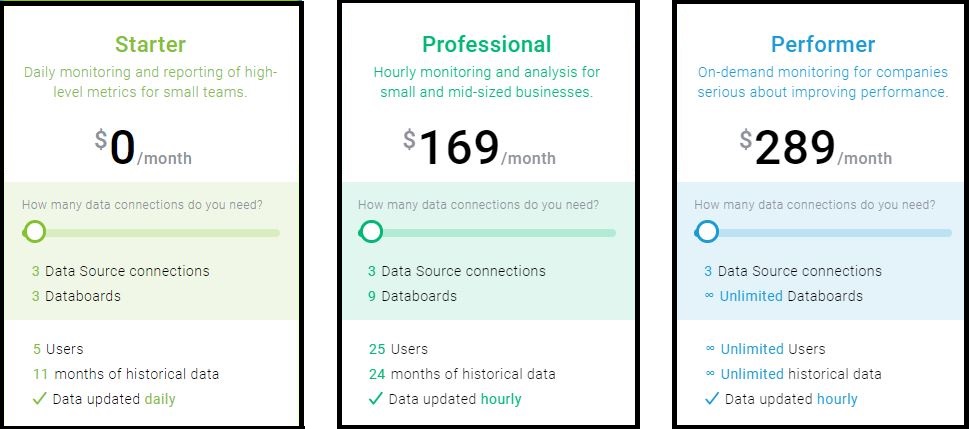
Starter plan – Free plan with 3 data sources, 3 databoards and upto 5 users support. Suitable for startups and small businesses with basic reporting needs.

Professional plan – Starts at $169/month and offers more advanced features, integrations, and support.

Performer plan – Starts at $289/month and provides enterprise-level features, priority support, and custom onboarding.

Apart from these monthly plans they also offer Annual Plans with 20% discount.

For more detailed info on pricing plans and features, visit their Website Databox/pricing

Reviews

0.0
Rated 0.0 out of 5
0.0 out of 5 stars (based on 0 reviews)
Excellent0%
Very good0%
Average0%
Poor0%
Terrible0%

There are no reviews yet. Be the first one to write one.

Alternate Tools

Databox

Take your Data To The Next Level with Databox - The Powerful Business Analytics and Data Visualization Platform that Brings All your Data Together in One Place.

Read More
Mixpanel

Discover the power of Mixpanel - the advanced analytics platform that empowers businesses to track user behavior and optimize digital products. Learn how to leverage Mixpanel's user insights to drive growth and improve engagement.

Read More
Qlik Sense

Unlock the full potential of your data with Qlik Sense - the intuitive and powerful data analytics platform.

Read More
Looker Studio

Transform the way you access and analyze your data with Looker Studio - the intuitive and powerful data analytics platform. Learn how Looker Studio's advanced features and custom data models can help you gain valuable insights, make data-driven decisions, and drive growth for your business.

Read More
Google Analytics

Gain powerful insights into your website's performance with Google Analytics - the most widely used web analytics platform for website Optimization.

Read More

Share This Post